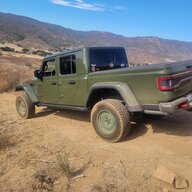
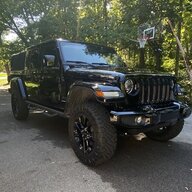
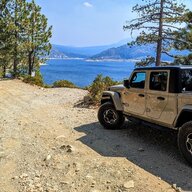
Something definitely doesn’t add up to me… I bought my Gladiator in early August and not only did I get it for $1000 under sticker, but Chrysler Capital was also offering 0% for 72 months.
There are definitely dealers marking them up over sticker, but most eventually come down to that price or a little less. The most I saw any dealers marking them up was $2k over sticker. Not sure why Chrysler would offer financing deals if they were actually going for 18.5% over sticker.
Maybe this was a survey financed by a dealer association to make the ones that are gouging people seem reasonable. ??
I used to see this all the time at work. Very common for people that don't understand data analysis and how spreadsheets work to come to comically wrong conclusions.
I switched over to IT where now I am the dumbest one in the room of smart people. Very humbling after being the smartest in a room of dumb people.
It’s amazing to me none of those buyers didn’t just do a couple hours of research for a dealer giving deals under invoice. Going by that average I saved about $14k.